The Graph page
On this page the data gets visualized.

Challenges
A list of some challenges we faced with this page.
XAML of the Chart

Code showcasing the XAML file containing the chart
The space for the chart is prepared in the XAML code. We have a main grid containing labels with the title and a short description of the current data being shown. With 2 pickers inside a smaller grid in the row below: One to change the data and another to change the graph type.
-
We did not populate the pickers in the XAML file. We couldn't find a way to make our translations work directly in the XAML code. Therefore the correct translation is added to the picker in the code behind.
In the last row the space for the ChartView is prepared. To get this ChartView we used a plugin called Microcharts.
Creating data points for the charts
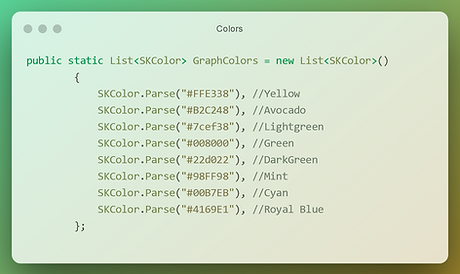
The colors are stored in a list

ChartEntry lists are populated with data and colors
The data points used to populate the charts are called ChartEntries. While saving the groups, and performing the calculations for the results page, 3 group dictionaries are made.
-
Contains the general data of the group: name, total, selection and unknown status.
-
Contains the selection rate data. With the selection rate represented both as a number and as a percentage.
-
Contains the Adverse Impact data.
The four data lists are prepared as empty lists of the type ChartEntry. Then one by one these are filled with their respective CreateData() function. In the image above we see the function populating the selection rate list CreateDataSelectionRate().
While creating the chart we need to make sure that the colors of the label and the graph bar match. The variable "i" is used to get a color at a certain index from the GraphColors list. This color is then added to both the graph bar and the label of the same ChartEntry. For every ChartEntry "i" is changed to a different value.
Populating the graphs

Code showcasing the way graphs are build
Populating the chart only needs 2 elements:
-
The chart type you want to display
-
A list of chart entries to populate the current chart type
Because of our preparation this is a simple action. We made 2 variables that keep track of the current chart type and data selection. The default chart type is a Bar Chart showing the data of the total numbers.
Whenever the user wants to switch the chart type they can pick one from the picker. When the user makes its selection, the current chart type is updated and the GraphBuilder() function is called. Replacing the current chart with a new one of the chosen type. The chart then gets populated by the InsertEntries() function.
Changing the data showcased in the chart is really simple. We prepared 4 lists containing all the ChartEntry data. Whenever the user picks a new data type the current chart simply gets updated by that list with the InsertEntries() function.